NCStickの出力を整理する処理ルーチン(filter_objects)
35行目
NCStickの生の出力を整理して、各Gridが何と認識したのか整理して出力する。
パラメータは
inference_result: NCStickの出力をfloat32にキャストした配列(1次元×要素数1470)input_image_width: 画像幅(448)input_image_height: 画像高(448)
出力は
classes_boxes_and_probs: 整理された認識結果
def filter_objects(inference_result, input_image_width, input_image_height):
各パラメータのサイズ
37行目
このサイズはニューラルネット構築の際に決定された値。
Graphファイルに紐づいた値と考えられる。
なので、グローバル変数で定義しておいてパラメータで渡す方が良さそうだが。。。
num_inference_results: NCStickの出力のサイズ(1470 : 未使用)network_classifications: 各クラスのラベル(認識結果の名称)num_classifications: その個数(20)grid_size: 画像のGrid分割数(7)boxes_per_grid_cell: 各グリッドに割り当てられたバウンティングボックス数(2)
以下は認識結果を整理するためのパラメータ。
probability_threshold: 認識結果の確率の閾値。これ以下の確率は無視する。
    # the raw number of floats returned from the inference (GetResult())
    num_inference_results = len(inference_result)

    # the 20 classes this network was trained on
    network_classifications = ["aeroplane", "bicycle", "bird", "boat", "bottle", "bus", "car",
                               "cat", "chair", "cow", "diningtable", "dog", "horse", "motorbike",
                               "person", "pottedplant", "sheep", "sofa", "train","tvmonitor"]

    probability_threshold = 0.07

    num_classifications = len(network_classifications) # should be 20

    grid_size = 7 # the image is a 7x7 grid.  Each box in the grid is 64x64 pixels
    boxes_per_grid_cell = 2 # the number of boxes returned for each grid cell
すべての確率配列
55行目
サイズはグリッド分割数(7)×グリッド分割数(7)×バウンティングボックス数(2)×クラス数(20) で、一旦0クリアしておく。
all_probabilities = np.zeros((grid_size, grid_size, boxes_per_grid_cell, num_classifications))
各クラスの確率配列
60行目
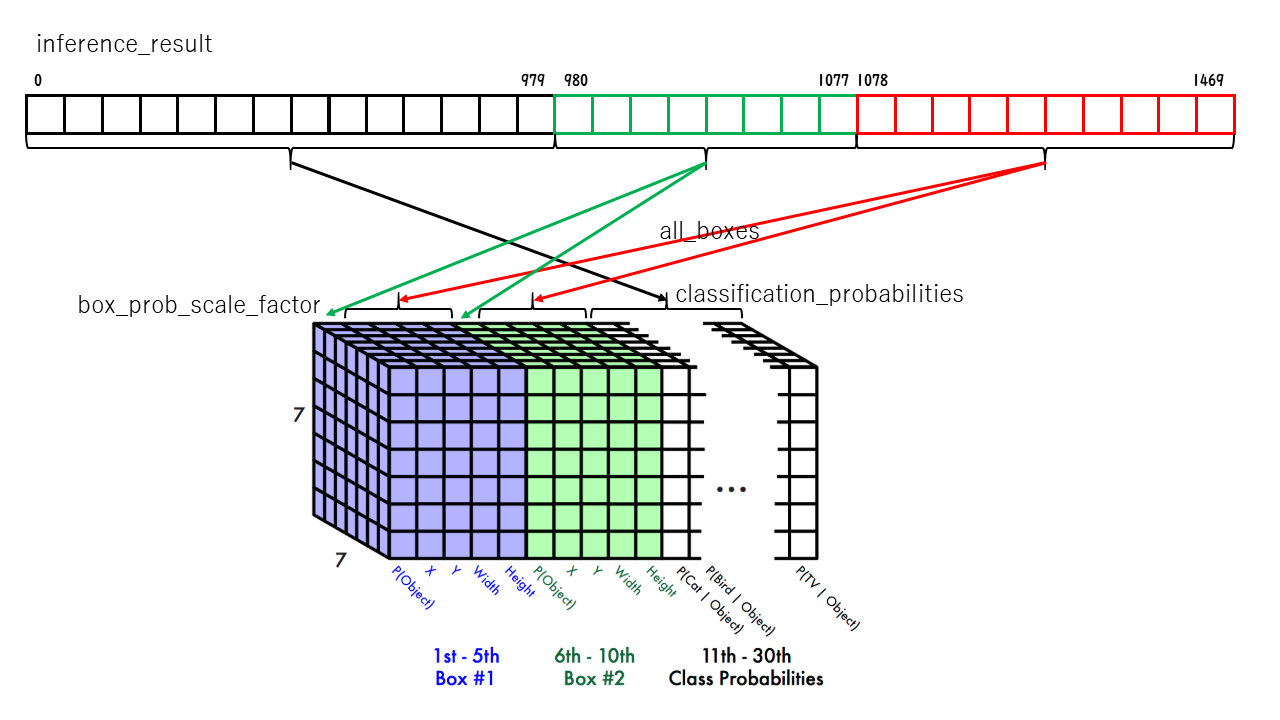
classification_probabilities : NCStickの出力から各クラスの確率配列を取り出す。
サイズはグリッド分割数(7)×グリッド分割数(7)×クラス数(20)
入力側は1次元配列なので、要素 0 ~ 979 (980個 = 7×7×20)
    classification_probabilities = \
        np.reshape(inference_result[0:980], (grid_size, grid_size, num_classifications))
    num_of_class_probs = len(classification_probabilities)
各バウンティングボックスの確率配列
65行目
box_prob_scale_factor : NCStickの出力から各バウンティングボックスの確率配列を取り出す。
サイズはグリッド分割数(7)×グリッド分割数(7)×バウンティングボックス数(2)
入力側は1次元配列なので、要素 980 ~ 1077 (98個 = 7×7×2)
box_prob_scale_factor = np.reshape(inference_result[980:1078], (grid_size, grid_size, boxes_per_grid_cell))
各バウンティングボックスの座標/サイズ情報配列
68行目
NCStickの出力から各バウンティングボックスの座標/サイズ情報配列を取り出す。
サイズはグリッド分割数(7)×グリッド分割数(7)×バウンティングボックス数(2)×XY幅高さ(4)
入力側は1次元配列なので、要素 1078 ~ 1469 (392個 = 7×7×2×4)
all_boxesの配列構成はこんな感じ。
[
  [
    [
      [X座標(グリッド内相対位置), Y座標(グリッド内相対位置), 幅(イメージサイズ比の平方根), 高さ(イメージサイズ比の平方根)],
      [X座標(グリッド内相対位置), Y座標(グリッド内相対位置), 幅(イメージサイズ比の平方根), 高さ(イメージサイズ比の平方根)],
    ]
    ・・・
    同じものがあと6組(合計7組)
  ]
  ・・・
  同じものがあと6組(合計7組)
]
幅と高さがイメージサイズに対する比率の平方根な理由は謎。。。
    # get the boxes from the results and adjust to be pixel units
    all_boxes = np.reshape(inference_result[1078:], (grid_size, grid_size, boxes_per_grid_cell, 4))
69行目
boxes_to_pixel_units(129行目)で
各バウンティングボックスの座標/サイズ情報配列を、入力画像幅(448)、入力画像高(448)、グリッドサイズ(7)からピクセル単位に変換
boxes_to_pixel_units(all_boxes, input_image_width, input_image_height, grid_size)
boxes_to_pixel_units 実行後の all_boxesの配列構成はこんな感じ。
[
  [
    [
      [X座標(pixel単位), Y座標(pixel単位), 幅(pixel単位), 高さ(pixel単位)],
      [X座標(pixel単位), Y座標(pixel単位), 幅(pixel単位), 高さ(pixel単位)],
    ]
    ・・・
    同じものがあと6組(合計7組)
  ]
  ・・・
  同じものがあと6組(合計7組)
]
これらの配列の再配列のイメージはこんな感じ。
72行目
各グリッドに対する各クラスの確率と各バウンティングボックスの確率を乗じてすべての確率配列を生成する。
all_probabilities は Grid_Y × Grid_X × BBox × NumClass の4次元配列。
データはバウンティングボックスごとの各クラスのスコアを示している。
(バウンティングボックスの確率 × クラスの確率)
データ構成はこんな感じ。
[
  [
    [
      [     0.5488,     0.7152,     0.6028,     0.5449,     0.4237,     0.6459, ]
      [     0.4376,     0.8918,     0.9637,     0.3834,     0.7917,     0.5289, ]
    ]
    for box_index in range(boxes_per_grid_cell): # loop over boxes
        for class_index in range(num_classifications): # loop over classifications
            all_probabilities[:,:,box_index,class_index] = np.multiply(classification_probabilities[:,:,class_index],box_prob_scale_factor[:,:,box_index])
77行目
すべての確率のマスク配列probability_threshold_maskを生成する。
データはall_probabilitiesの要素の値がprobability_threshold以上であればTrue、未満ならFalseが入っている。
データ構成はこんな感じ。
[
  [
    [
      [ True, True, True, True, False, True, ]
      [ False, True, True, False, True, True, ]
    ]
    ・・・・
probability_threshold_mask = np.array(all_probabilities>=probability_threshold, dtype='bool')
上の処理を書き換えるとこんな感じ。
probability_threshold_mask = np.empty(np.shape(all_probabilities), dtype='bool')
for gy in range(grid_size) :
    for gx in range(grid_size) :
        for bb in range(boxes_per_cell) :
            for cls in range(num_classifications) :
                probability_threshold_mask[gy][gx][bb][cls] = all_probabilities[gy][gx][bb][cls] >= probability_threshold
78行目
box_threshold_mask は 4 × 閾値を超えたスコアの数 の 2次元配列。
all_boxes、all_probabilitiesから有効なデータを取り出すためのマスクデータ。
probability_threshold_maskで要素がtrueのもの(=ゼロでないもの)のインデックス一覧をに格納する。
box_threshold_mask[0][n]: n番目の閾値を超えたスコアを持つY方向のグリッド番号box_threshold_mask[1][n]: n番目の閾値を超えたスコアを持つX方向のグリッド番号box_threshold_mask[2][n]: n番目の閾値を超えたスコアを持つバウンティングボックス番号box_threshold_mask[3][n]: n番目の閾値を超えたスコアを持つクラス番号
つまり、
all_boxes[box_threshold_mask[0][n]][box_threshold_mask[1][n]][box_threshold_mask[2][n]]
all_probabilities[box_threshold_mask[0][n]][box_threshold_mask[1][n]][box_threshold_mask[2][n]][0または1]
がそれぞれn番目の閾値を超えたスコアを持つバウンティングボックスの座標/大きさ情報とスコア(バウンティングボックスごとのペア)を持つ
データ構成はこんな感じ。
[
  [ 0, 0, 0, 0, 0, 0, ・・・・
  [ 0, 0, 0, 0, 0, 0, ・・・・]
  [ 0, 0, 0, 0, 0, 1, ・・・・]
  [ 0, 1, 2, 3, 5, 1, ・・・・]
]
box_threshold_mask = np.nonzero(probability_threshold_mask)
上の処理を書き換えるとこんな感じ。
    gx_list  = np.array([], dtype='int')
    gy_list  = np.array([], dtype='int')
    bb_list  = np.array([], dtype='int')
    cls_list = np.array([], dtype='int')
    for gy in range(grid_size) :
        for gx in range(grid_size) :
            for bb in range(boxes_per_cell) :
                for cls in range(num_classifications) :
                    if probability_threshold_mask[gy][gx][bb][cls] :
                        gy_list  = np.append(gy_list,  gy)
                        gx_list  = np.append(gx_list,  gx)
                        bb_list  = np.append(bb_list,  bb)
                        cls_list = np.append(cls_list, cls)
    box_threshold_mask = (gy_list, gx_list, bb_list, cls_list)
79行目
boxes_above_threshold は 閾値を超えたスコアの数 × 4 の 2次元配列
boxes_above_threshold[n]: n番目の閾値を超えたスコアを持つバウンティングボックスの座標/サイズ情報のセットboxes_above_threshold[n][0]: X座標(pixel単位)boxes_above_threshold[n][1]: Y座標(pixel単位)boxes_above_threshold[n][2]: 幅(pixel単位)boxes_above_threshold[n][3]: 高さ(pixel単位)
boxes_above_threshold = all_boxes[box_threshold_mask[0],box_threshold_mask[1],box_threshold_mask[2]]
上の処理を書き換えるとこんな感じ。
    boxes_above_threshold = np.empty((0, 4), float)
    for i0 in range(len(box_threshold_mask[0])) :
        box_info = all_boxes[box_threshold_mask[0][i0]][box_threshold_mask[1][i0]][box_threshold_mask[2][i0]]
        box_info = np.reshape(box_info, (1, 4))
        boxes_above_threshold = np.append(boxes_above_threshold, box_info, axis = 0)
80行目
・・・ う~ん ・・・
classifications_for_boxes_above = np.argmax(all_probabilities,axis=3)[box_threshold_mask[0],box_threshold_mask[1],box_threshold_mask[2]]
なんか複雑な式なのでちょっと分割してみる。
    tmp_data = np.argmax(all_probabilities,axis=3)
    classifications_for_boxes_above = tmp_data[box_threshold_mask[0],box_threshold_mask[1],box_threshold_mask[2]]
tmp_data は Grid_Y × Grid_X × BBox の3次元配列
データは各グリッドにBBoxずつ定義されたバウンティングボックスの各クラスに対するスコアの中から最大値を持つ要素のインデックス(=クラス番号)
np.argmax()は配列要素の最大値を取るメソッド。
all_probabilities[GY][GX][BB][CLS]の4次元配列に対してaxis=3を指定して実行していて、
all_probabilities[gy][gx][bb][0~NumCls]の最大値を持つ要素のインデックスを tmp_data[gy][gx][bb]に格納する
データ構成はこんな感じ。
[
  [
    [ 1, 2, ]
    [ 1, 2, ]
    [ 3, 1, ]
    [ 2, 0, ]
    [ 4, 2, ]
    [ 2, 4, ]
    [ 0, 5, ]
  ]
  ・・・
classifications_for_boxes_above は 閾値を超えたスコアの数 の 1次元配列
データは各グリッドのスコアが最大のクラス番号を格納した1次元配列
データ構成はこんな感じ。
[ 1, 1, 1, 1, ・・・
上の処理を書き換えるとこんな感じ。
    tmp_data  = np.empty((grid_size, grid_size, boxes_per_cell), dtype='int')
    for gy in range(grid_size) :
        for gx in range(grid_size) :
            for bb in range(boxes_per_cell) :
                a = all_probabilities[gy][gx][bb].tolist()
                tmp_data[gy][gx][bb] = a.index(max(a))
    classifications_for_boxes_above =  np.array([], dtype='int')
    for i0 in range(len(box_threshold_mask[0])) :
        classifications_for_boxes_above = np.append(classifications_for_boxes_above, tmp_data[box_threshold_mask[0][i0]][box_threshold_mask[1][i0]][box_threshold_mask[2][i0]])
81行目
probabilities_above_threshold は 閾値を超えたスコアの数 の 1次元配列。
probabilities_above_threshold[n]: n番目の閾値を超えたスコア
probabilities_above_threshold = all_probabilities[probability_threshold_mask]
上の処理を書き換えるとこんな感じ。
    probabilities_above_threshold  = np.array([], dtype='float')
    for gy in range(grid_size) :
        for gx in range(grid_size) :
            for bb in range(boxes_per_cell) :
                for cls in range(num_classifications) :
                    if probability_threshold_mask[gy][gx][bb][cls] :
                        probabilities_above_threshold  = np.append(probabilities_above_threshold, all_probabilities[gy][gx][bb][cls])
この時点でスコアが閾値を超えたグリッドの情報が
classifications_for_boxes_aboveprobabilities_above_thresholdboxes_above_threshold
に格納される。これらは 一対一対一 の関係になっている。
boxes_above_threshold は 2次元配列だが、X, Y, WIDTH, HEIGHT のペアの配列と考えればわかりやすい。
classifications_for_boxes_above[n]: n番目の閾値を超えたスコアを持つクラス番号probabilities_above_threshold[n]: n番目の閾値を超えたスコアboxes_above_threshold[n]: n番目の閾値を超えたスコアを持つバウンティングボックスの座標/サイズ情報のセットboxes_above_threshold[n][0]: X座標(pixel単位)boxes_above_threshold[n][1]: Y座標(pixel単位)boxes_above_threshold[n][2]: 幅(pixel単位)boxes_above_threshold[n][3]: 高さ(pixel単位)
85行目
argsort は probabilities_above_threshold の各要素を降順に並べた際のインデックス番号を取り出した1次元配列。
argsort(~) は 指定された配列 の各要素を昇順に並べた際のインデックス番号を取り出した配列を得るメソッド。
[::-1]を付けてあるので降順になる。
そのままだとlist型になってしまうので、np.array()でnp.ndarray型に変換する。
argsort = np.array(np.argsort(probabilities_above_threshold))[::-1]
86行目
argsort を使って
classifications_for_boxes_above、probabilities_above_threshold、boxes_above_threshold から argsortで示されたインデックスで示された順に取り出す。
⇒ スコアの降順にそれぞれを並べ変える。
    boxes_above_threshold = boxes_above_threshold[argsort]
    classifications_for_boxes_above = classifications_for_boxes_above[argsort]
    probabilities_above_threshold = probabilities_above_threshold[argsort]
書き換えるほどでもないので、ま、いっか。
92行目
duplicate_box_mask は boxes_above_threshold を検索して重なったボックス情報を削除するためのマスク情報配列。
閾値を超えたスコアの数 の dtype.bool型の1次元配列。
get_duplicate_box_mask() は 別ページ参照。
データ構成はこんな感じ。
[ True, True, False, False, True, ・・・]
boxes_above_threshold は 既にスコアの高い順に並べ替えられているので、先頭から検索していって最初の出てきたボックスを優先すれば良い。
duplicate_box_mask = get_duplicate_box_mask(boxes_above_threshold)
95行目
duplicate_box_mask を使ってそれぞれの配列からダブったデータを削除する。
classifications_for_boxes_above、probabilities_above_threshold、boxes_above_threshold から duplicate_box_maskでTrueの要素だけ取り出す。
boxes_above_thresholdは ダブっていない結果の数(最終認識結果の数) × 4 の 2次元配列
それ以外は ダブっていない結果の数(最終認識結果の数)の 1次元配列
    boxes_above_threshold = boxes_above_threshold[duplicate_box_mask]
    classifications_for_boxes_above = classifications_for_boxes_above[duplicate_box_mask]
    probabilities_above_threshold = probabilities_above_threshold[duplicate_box_mask]
99行目
最終認識結果をlistにまとめなおしてリターンする。
classes_boxes_and_probs は 最終認識結果数 × 6 の 2次元配列(list)
データ構成はこんな感じ。
classes_boxes_and_probs[n][0]: クラスのラベル(認識結果の名称; 文字列)classes_boxes_and_probs[n][1]: X座標(pixel単位)classes_boxes_and_probs[n][2]: Y座標(pixel単位)classes_boxes_and_probs[n][3]: 幅(pixel単位)classes_boxes_and_probs[n][4]: 高さ(pixel単位)classes_boxes_and_probs[n][5]: スコア
    classes_boxes_and_probs = []
    for i in range(len(boxes_above_threshold)):
        classes_boxes_and_probs.append([network_classifications[classifications_for_boxes_above[i]],boxes_above_threshold[i][0],boxes_above_threshold[i][1],boxes_above_threshold[i][2],boxes_above_threshold[i][3],probabilities_above_threshold[i]])

    return classes_boxes_and_probs